
flowchart TD
  A(Adminster Tests) --> B(Score Tests)
  B --> C(Convert Scores)
  C --> D(Tabulate)
  D --> E(Visualise)
  E --> F(Report)
Neuropsychology as Developers
Why are neuropsychologists also good developers?
Analytical minds 🤓
Scientific method 🧑🔬
Our history 🔍
Empirical approach to assessment
Progress Values 💪
Public sector 💸

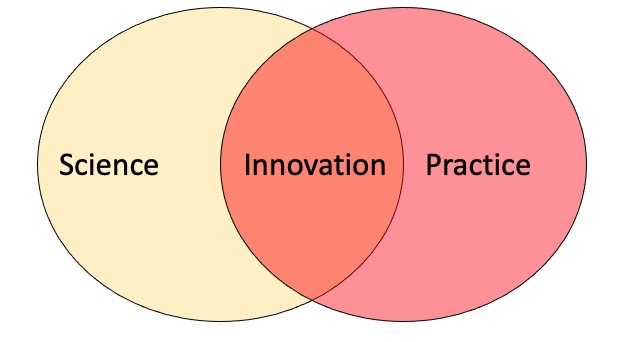
Innovators!
Neuropsychologists are model innovators wtihin healthcare!
But where is leading the endeavour for Neuropsychology?

However…
Outdated products
Qinteractive 👎
Old fashioned resources 👎
Outdated assessments 👎
Irrelevant norms 👎
Manual scoring 👎

However…
Unknown products
Virtual Reality❓
NLP❓
Precision medicine❓
Automated Reports❓
Disruptive Technology:
An innovation that creates a new market or enters at the bottom of an existing market and eventually displaces established market-leading firms, products, and alliances


Disruptive Technology Initiative
To encourage development of educational and assessment models that embrace multidisciplinary technological innovations, making neuropsychologists not just consumers of technology, but actual cutting-edge producers of technology.
American Academy of Clinical Neuropsychology
![]()
Why Is It left To Us?
We have the skills to be able to do it.
We are already doing it! but usually at a local level.
Not a competitive market.
Proprietary companies don’t always have our best interests.
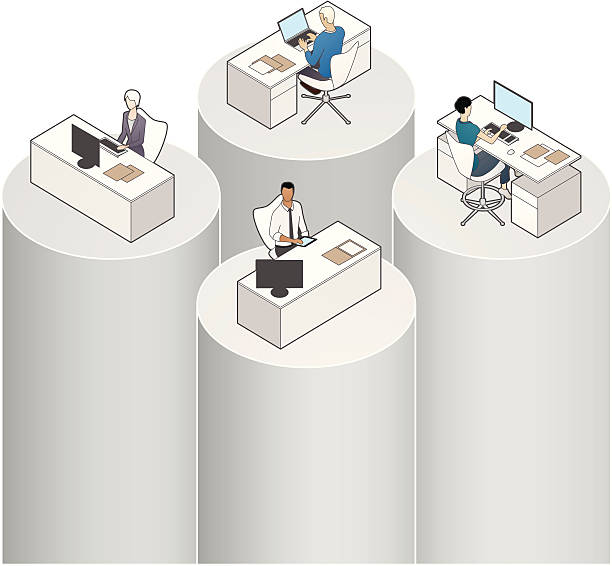
Making Our Tools Scalable
Lots of innovative work is done in silos.
Tools to help us
Expediteadministrative process and develop workflowsScoring Tools 🧰
Parametrised/Automated Reports 🤖
Visualisation 📈
Data Science
HTML (Apps, Books, Slides, Manuscripts)
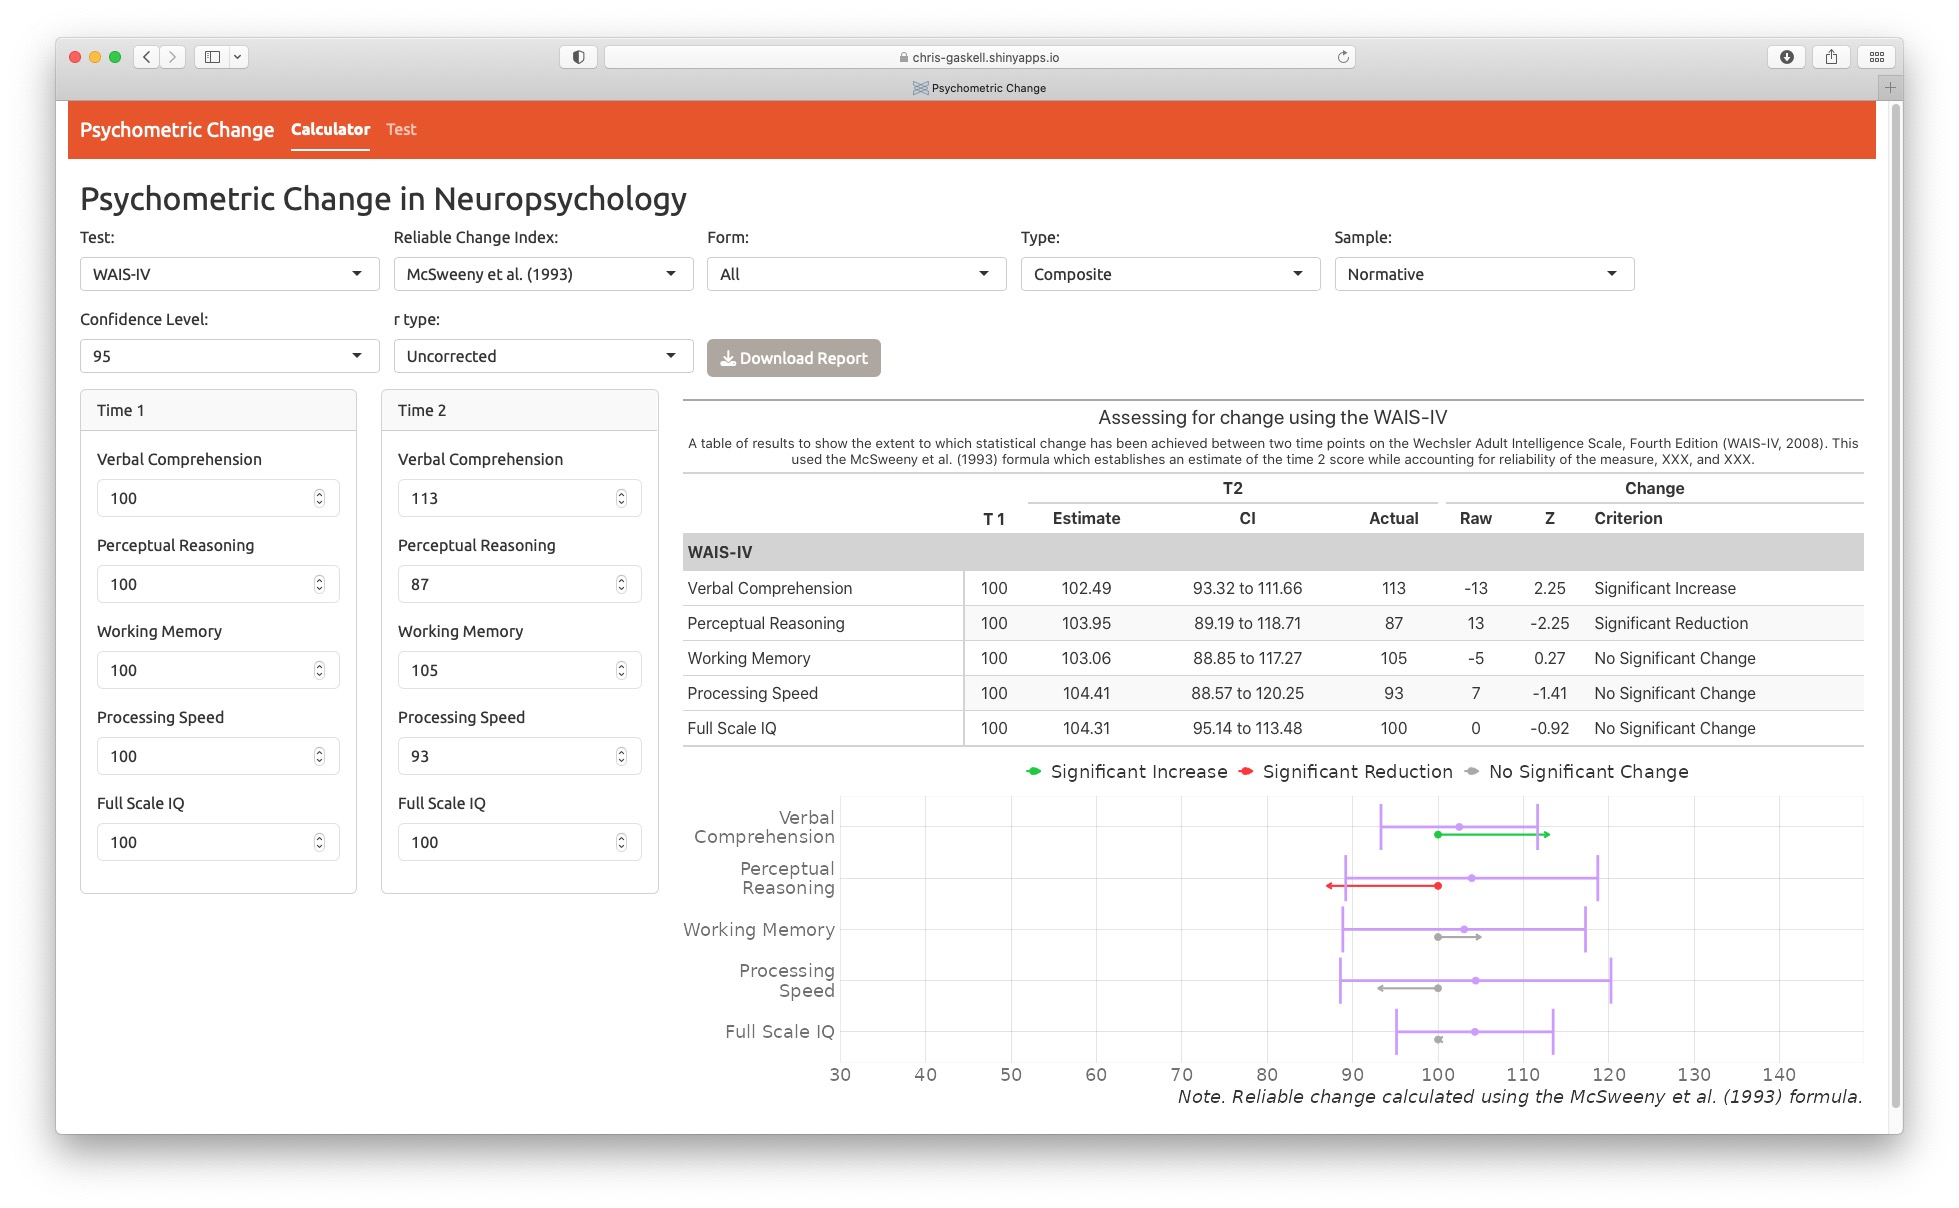
Shiny
An R package that makes it easy to build interactive web apps in the R programming environment.

Web Apps
Scalable.
Simple.
Open Source.
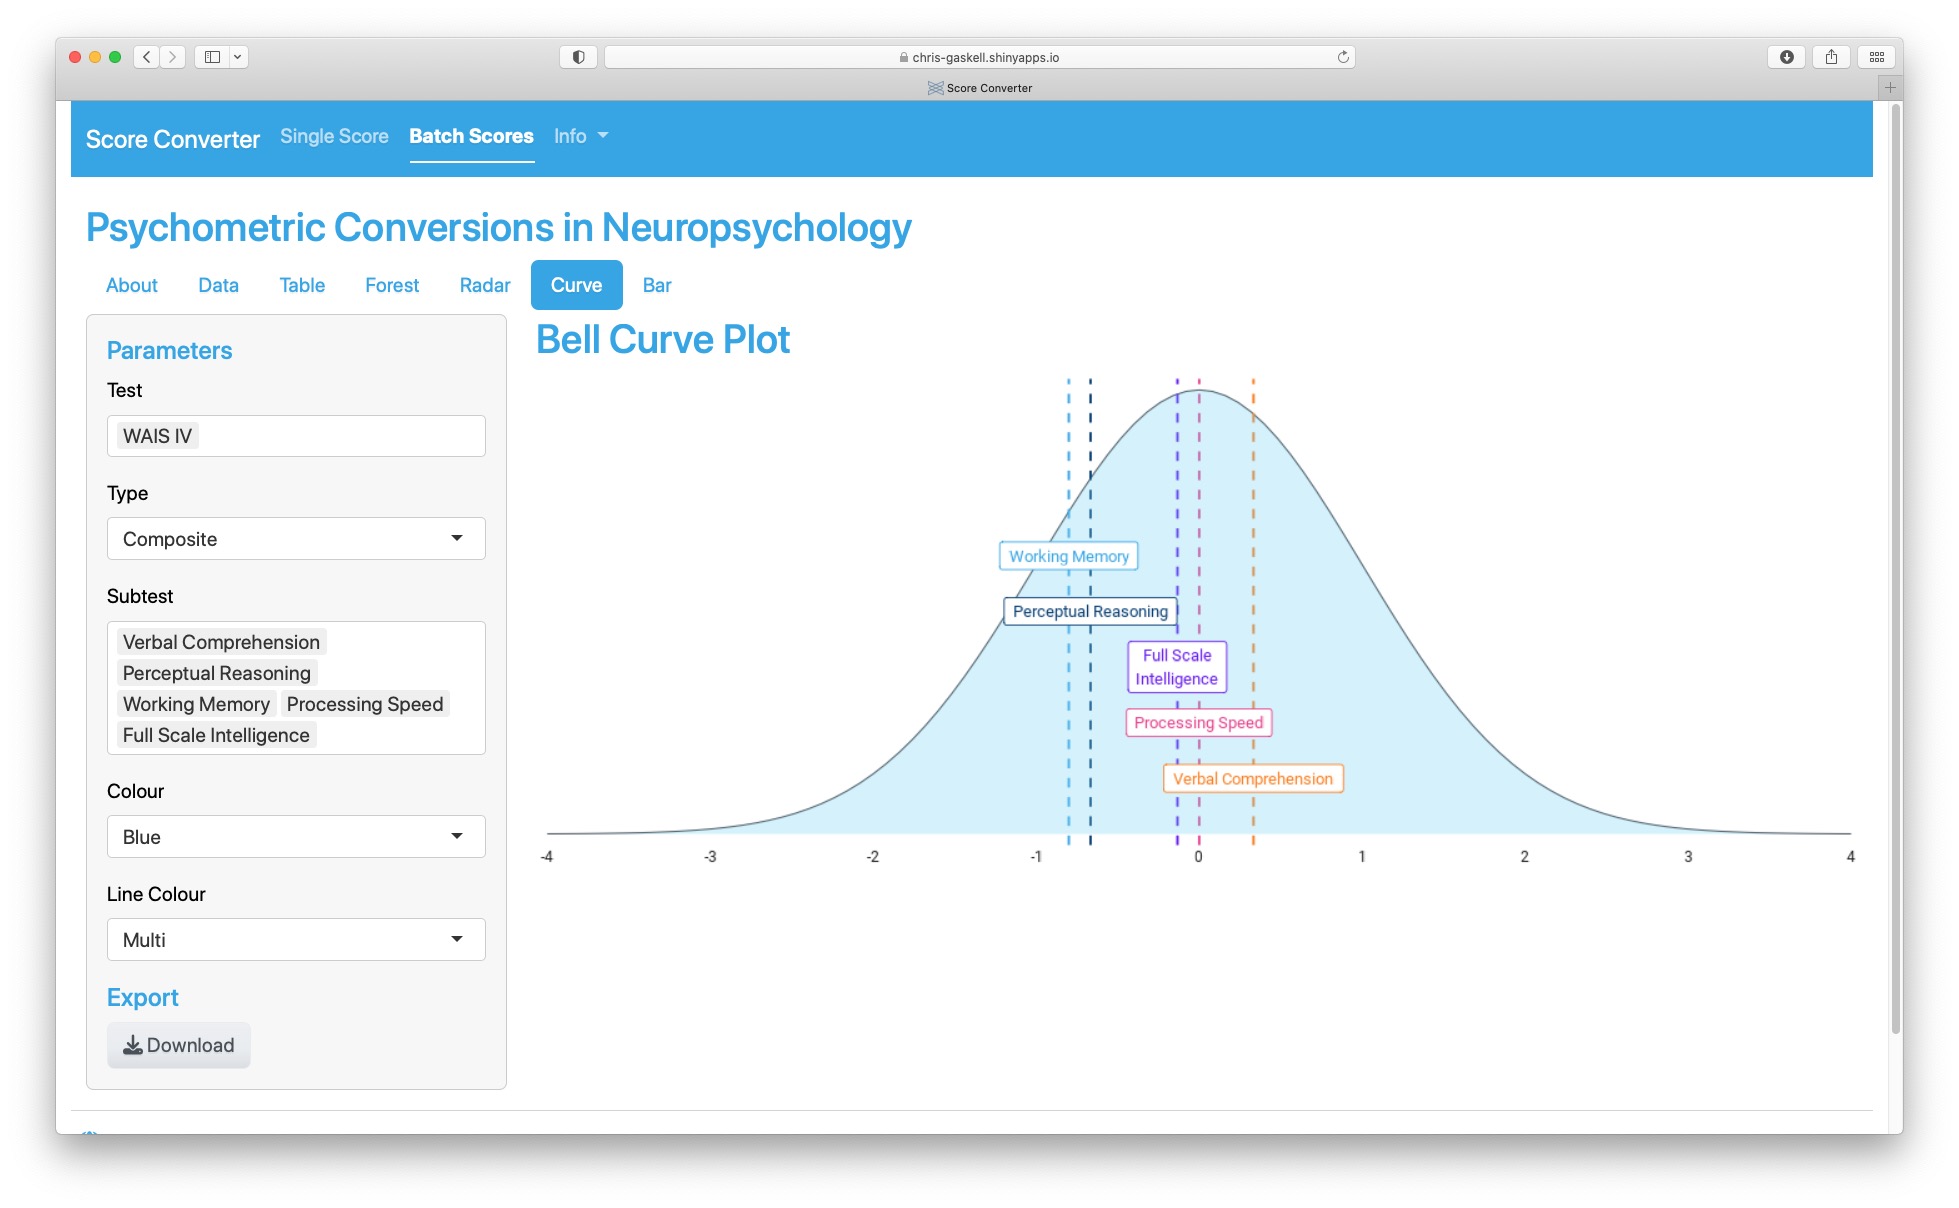
My Apps1
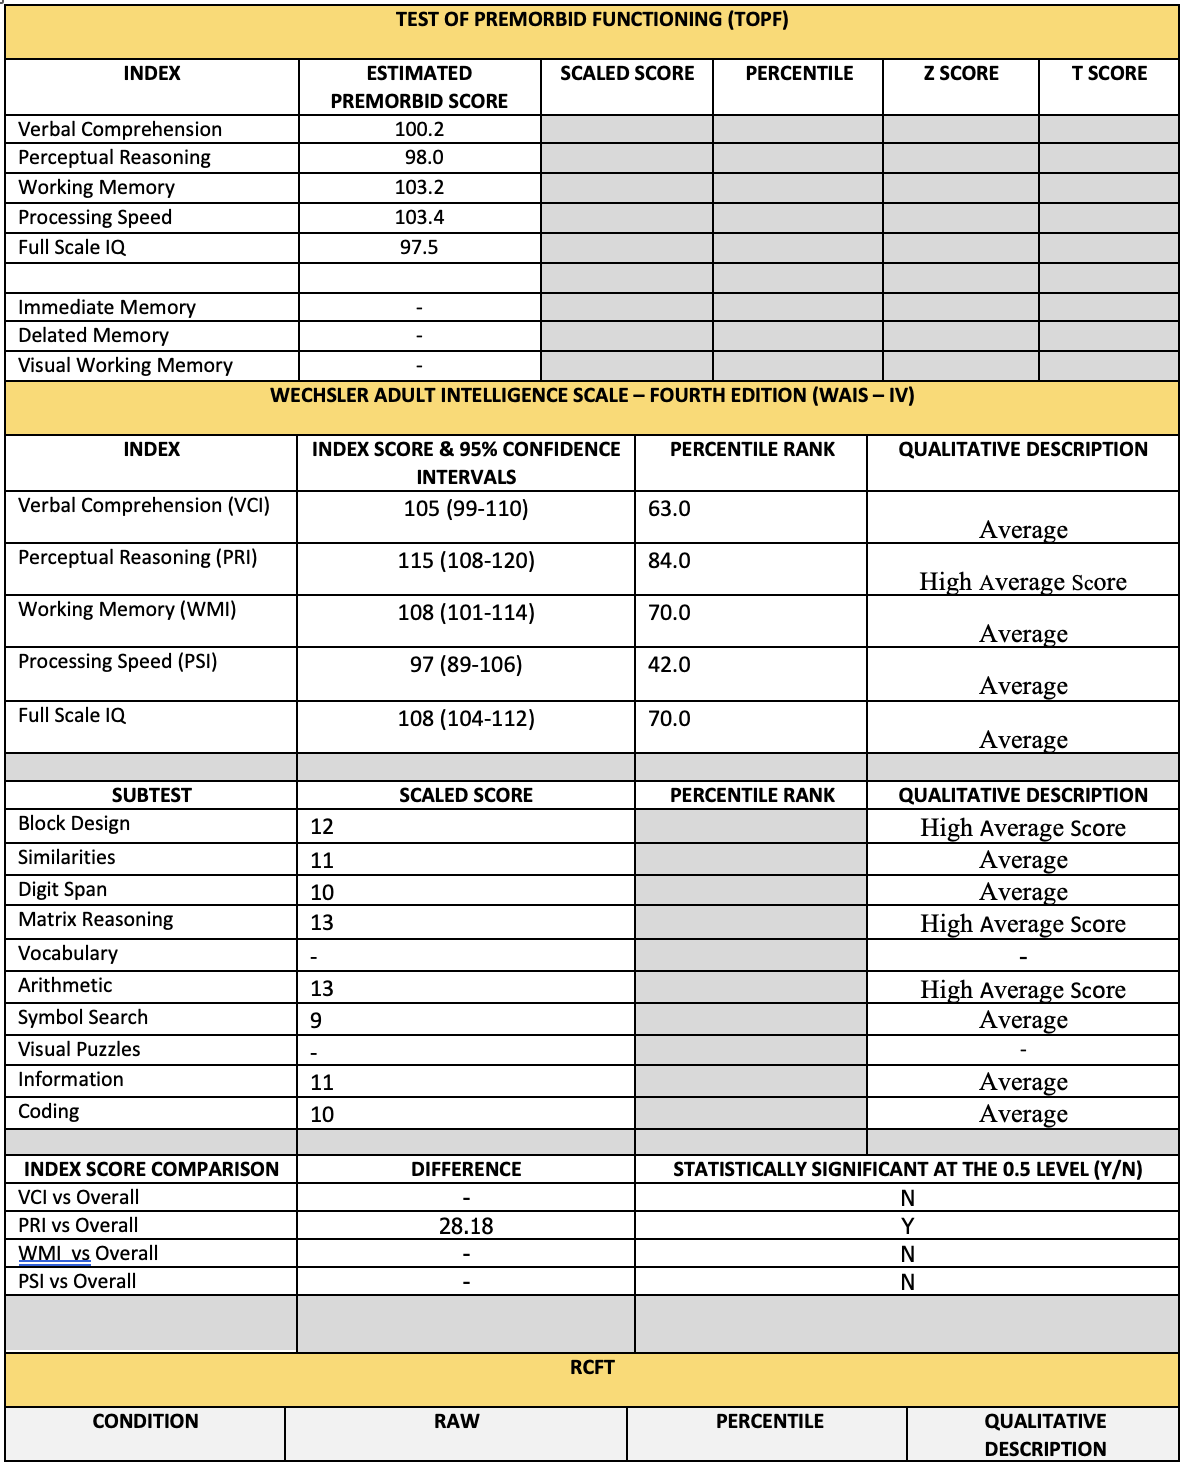
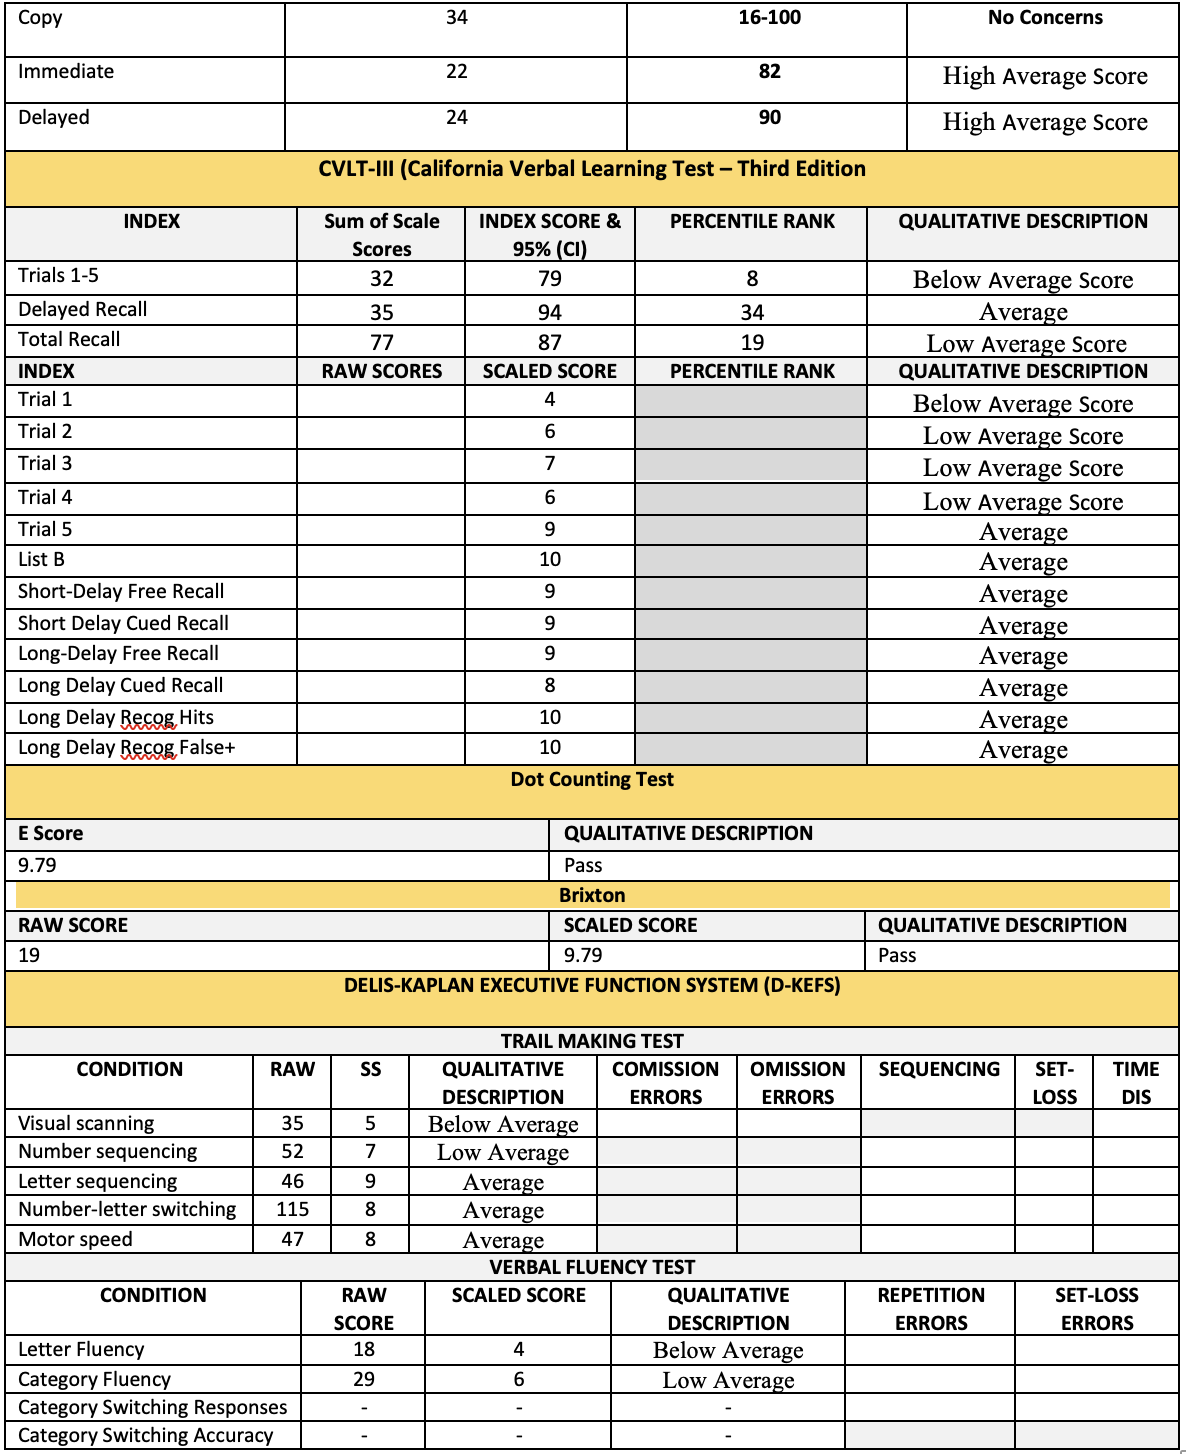
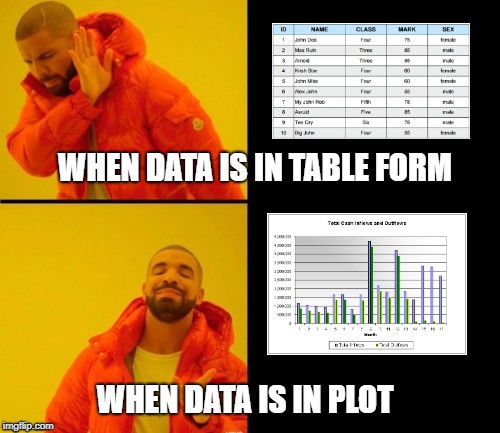
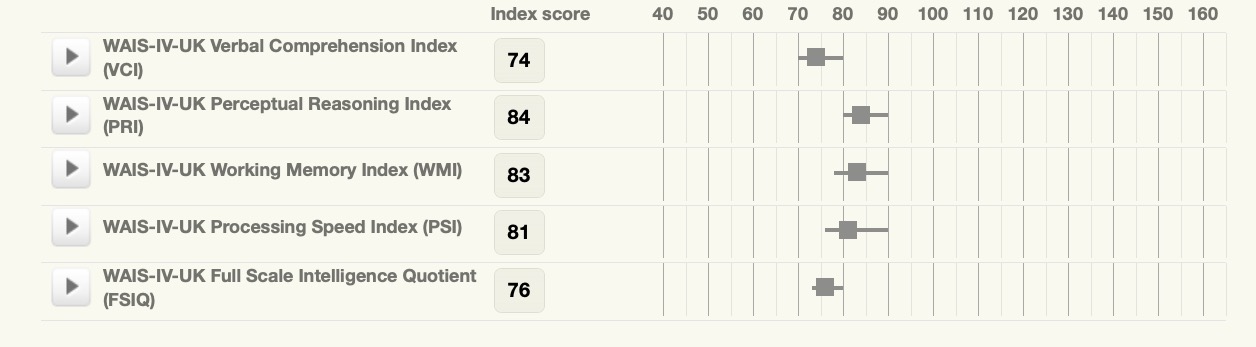
Tabulation
- Table of results are really important.
- Don’t always report the required information.
- Often look ugly and cumbersome.
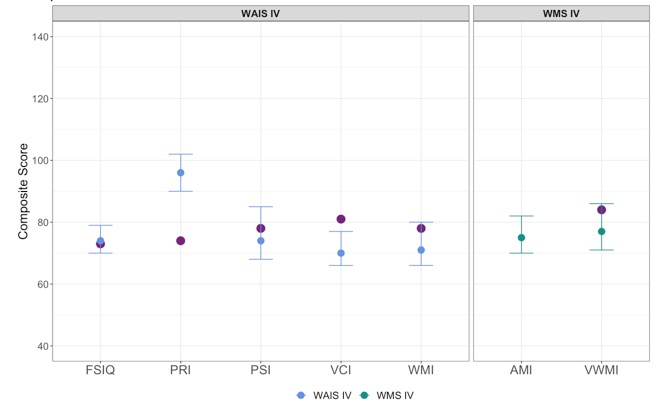
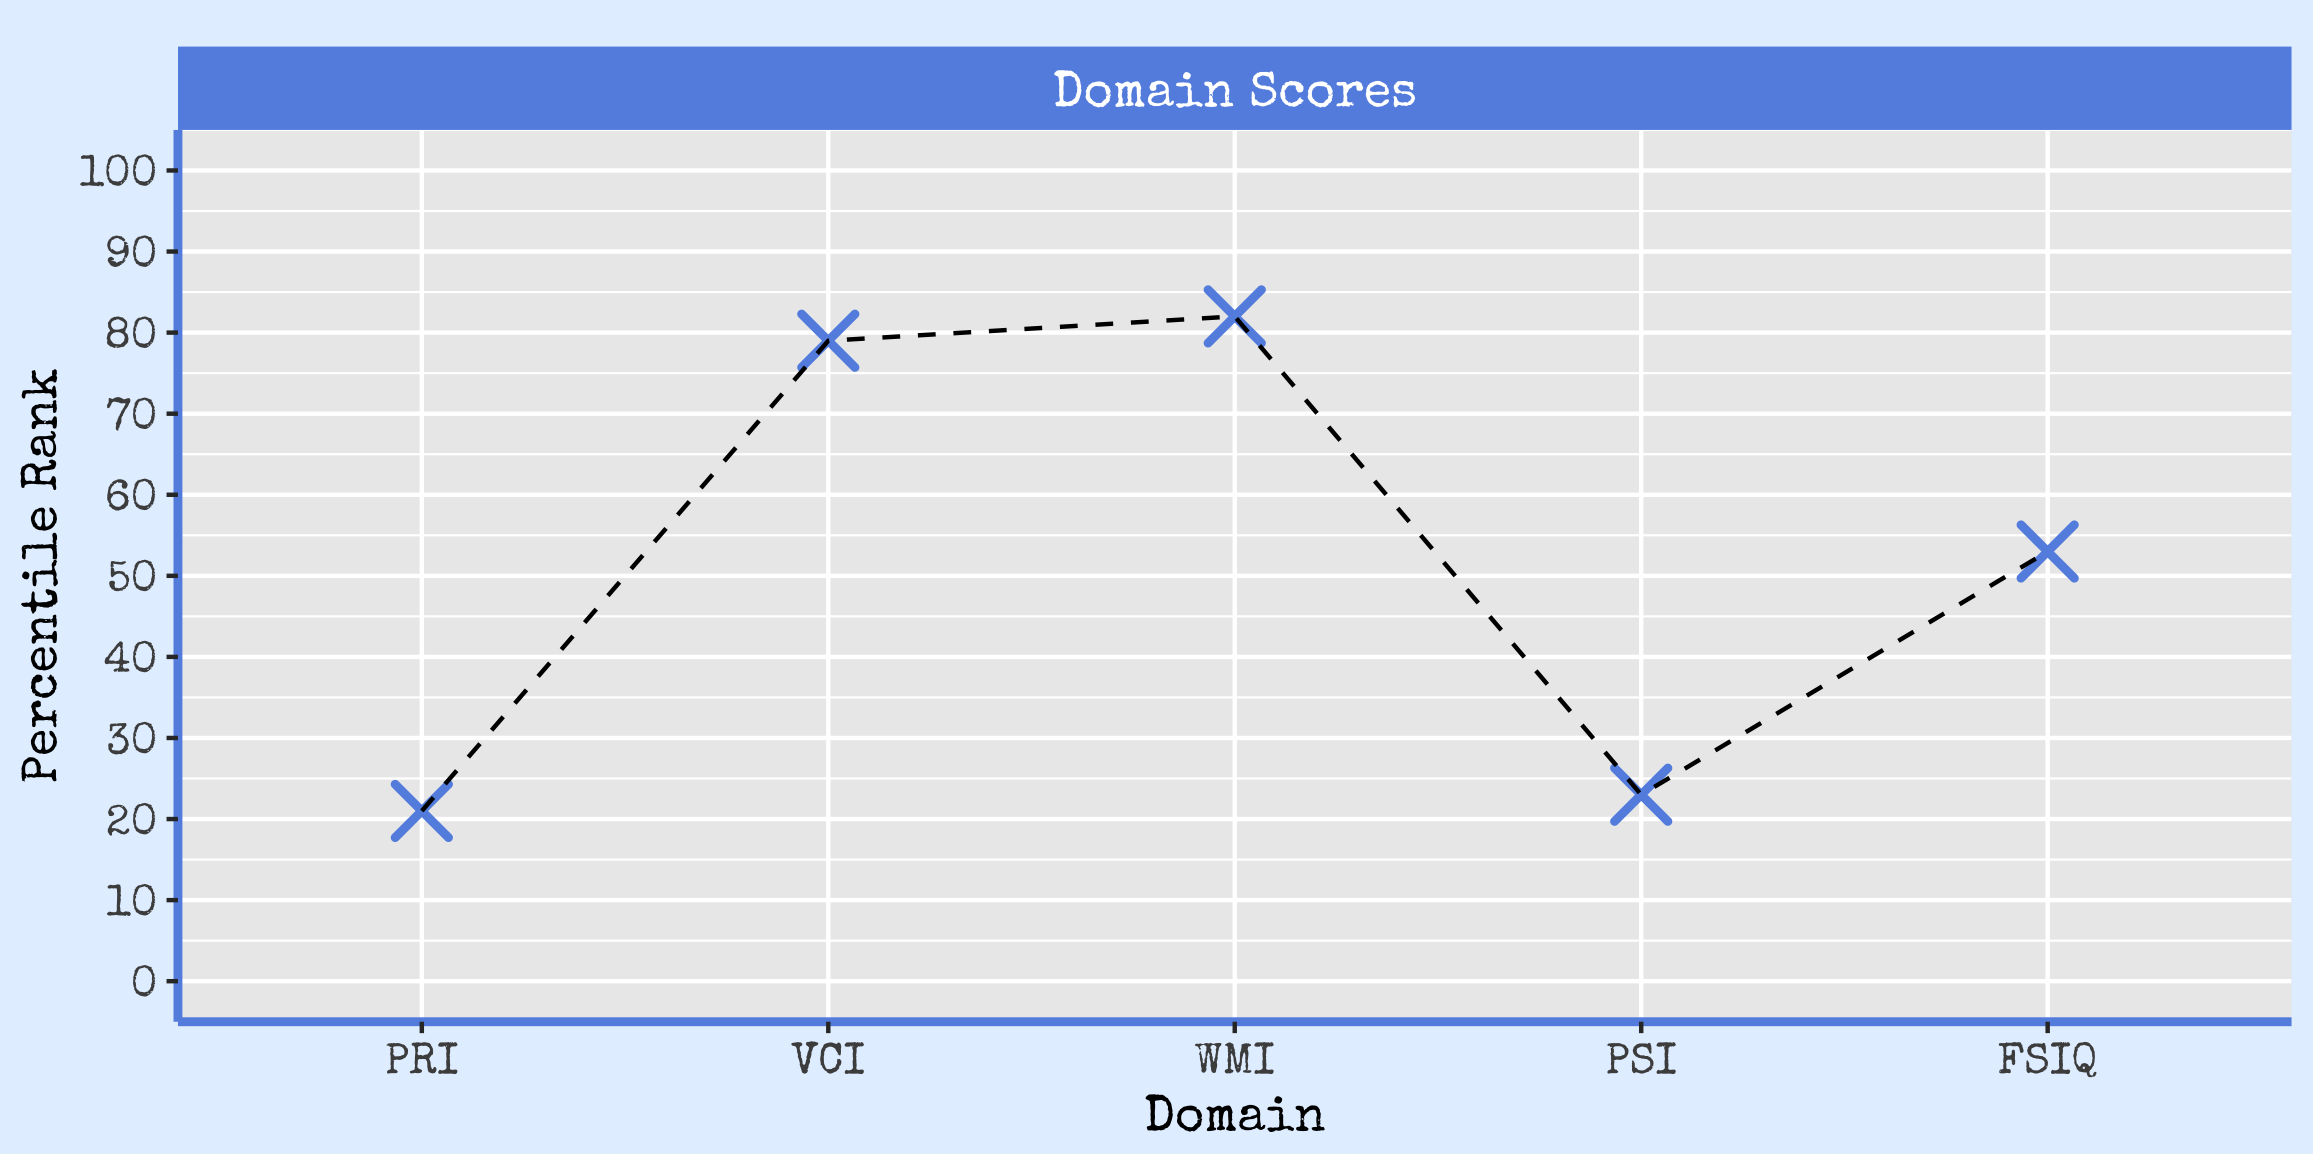
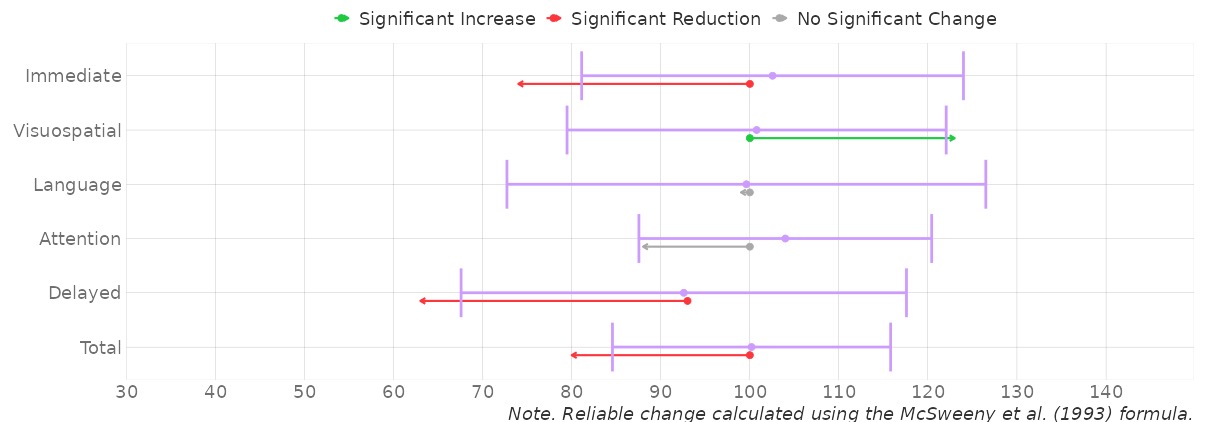
Visualisation
Data Visualisation is a really important tool for interpreting data!
Visualisation
Data Visualisation is a really important tool for interpreting data!
- More than just aesthetics!
- New insights (e.g., trends).
- Speeds up assimilation.
- Communication.
- Rarely used in practice.
Visualisation
Data Visualisation is a really important tool for interpreting data!
- More than just aesthetics!
- New insights (e.g., trends).
- Speeds up assimilation.
- Communication.
- Rarely used in practice.
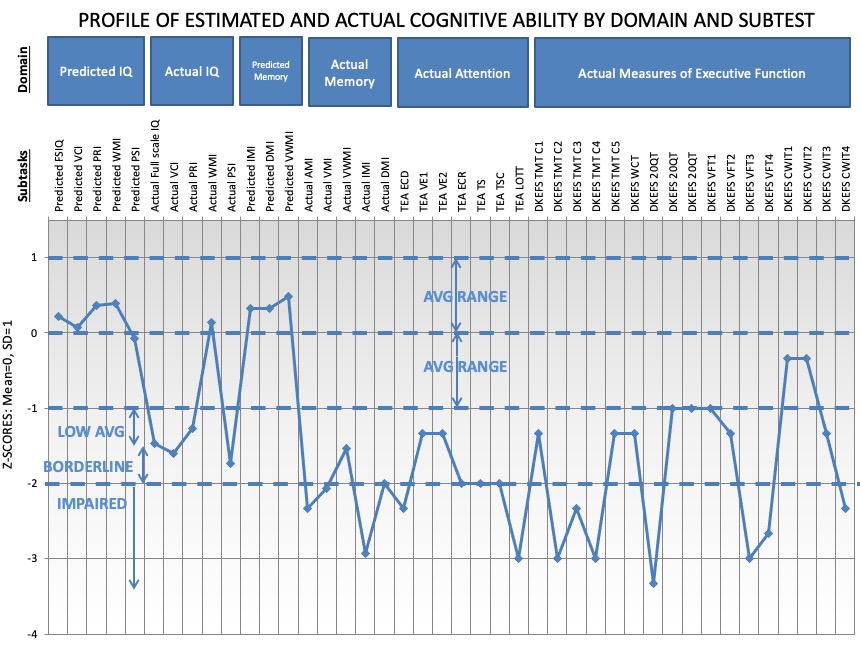
Problem 3:
Need to be able to easily visualise a range of test scores in a way that is intuitive for a variety of audiences.
Example Visualisations
Footnotes
Hover over an image and click to be directed to the web app.
\(Z\) Score, \(T\) Score, Wechsler Standard Score, Wechsler Scaled Score, Sten Score, Stanine Score, Vineland Scaled Score, ETS Score, etc.
Crawford (2010) in Goldestein (2010) Clinical Neuropsychology: A Practical Guide to Assessment and Management for Clinicians, 2nd Edition